

Besides an effective solar orientation and geographical position, a project to install photovoltaic panels is also challenged by physical impediments to sunlight like buildings, mountains and peripheral vegetation. The top of a tree can not be shadowing the installation location during the summer, where the sun has a more vertical orientation. But in the winter, with the lowest sun, the canopy can prevent much of the capture of photons as well. Synapsis have here an explanation of the solar orientation.
For this, an analysis of the shade all year round can be done in a few ways. Here, for example, two solar graphs showing the sun path in a certain direction, The University of Oregon provides a mechanism with which you can create a graph for the exact geographical conditions of an installation.
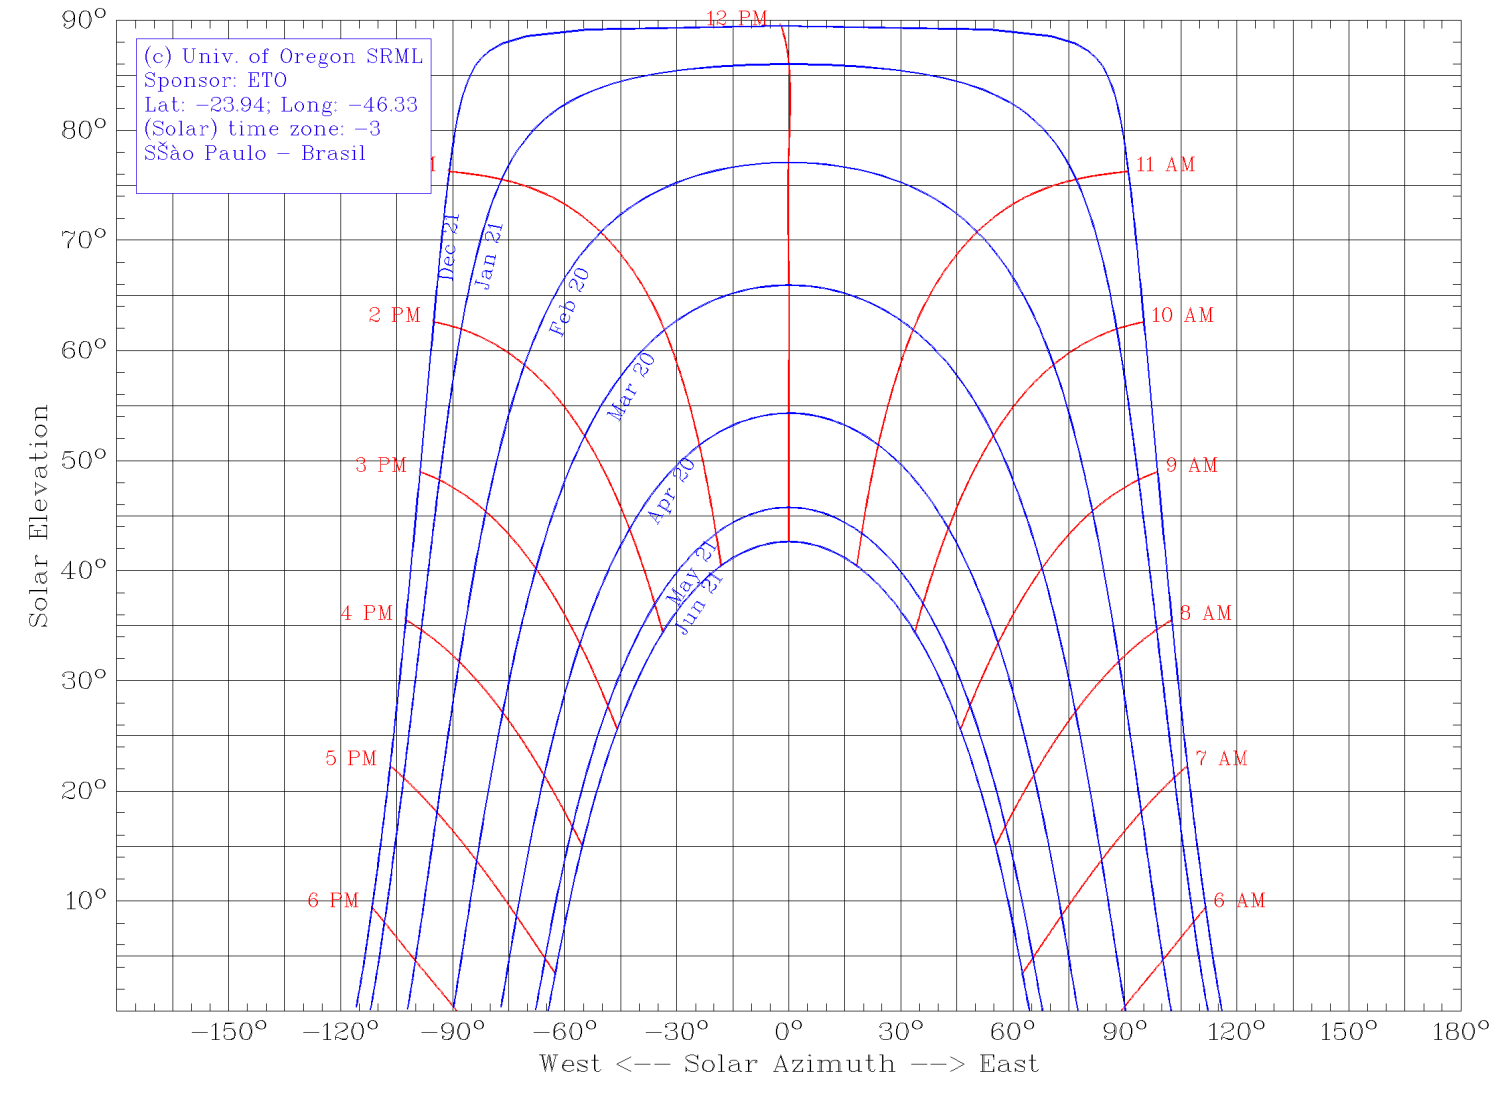
Sunchart to São Paulo – Brazil
This image is taken to the field (preferably on a transparent sheet), you orient it according to the indicated azimuth and we have the sun path throughout the year, crossing the impediments on this direction. The first chart above refers to São Paulo (Brazil), note that with the West (West) to the left and the East (East) to the right, we should align the azimuth 0° North. While in the second, below, which refers to Groningen in the north of the Netherlands, the opposite occurs, we guide it to the South as 0°.
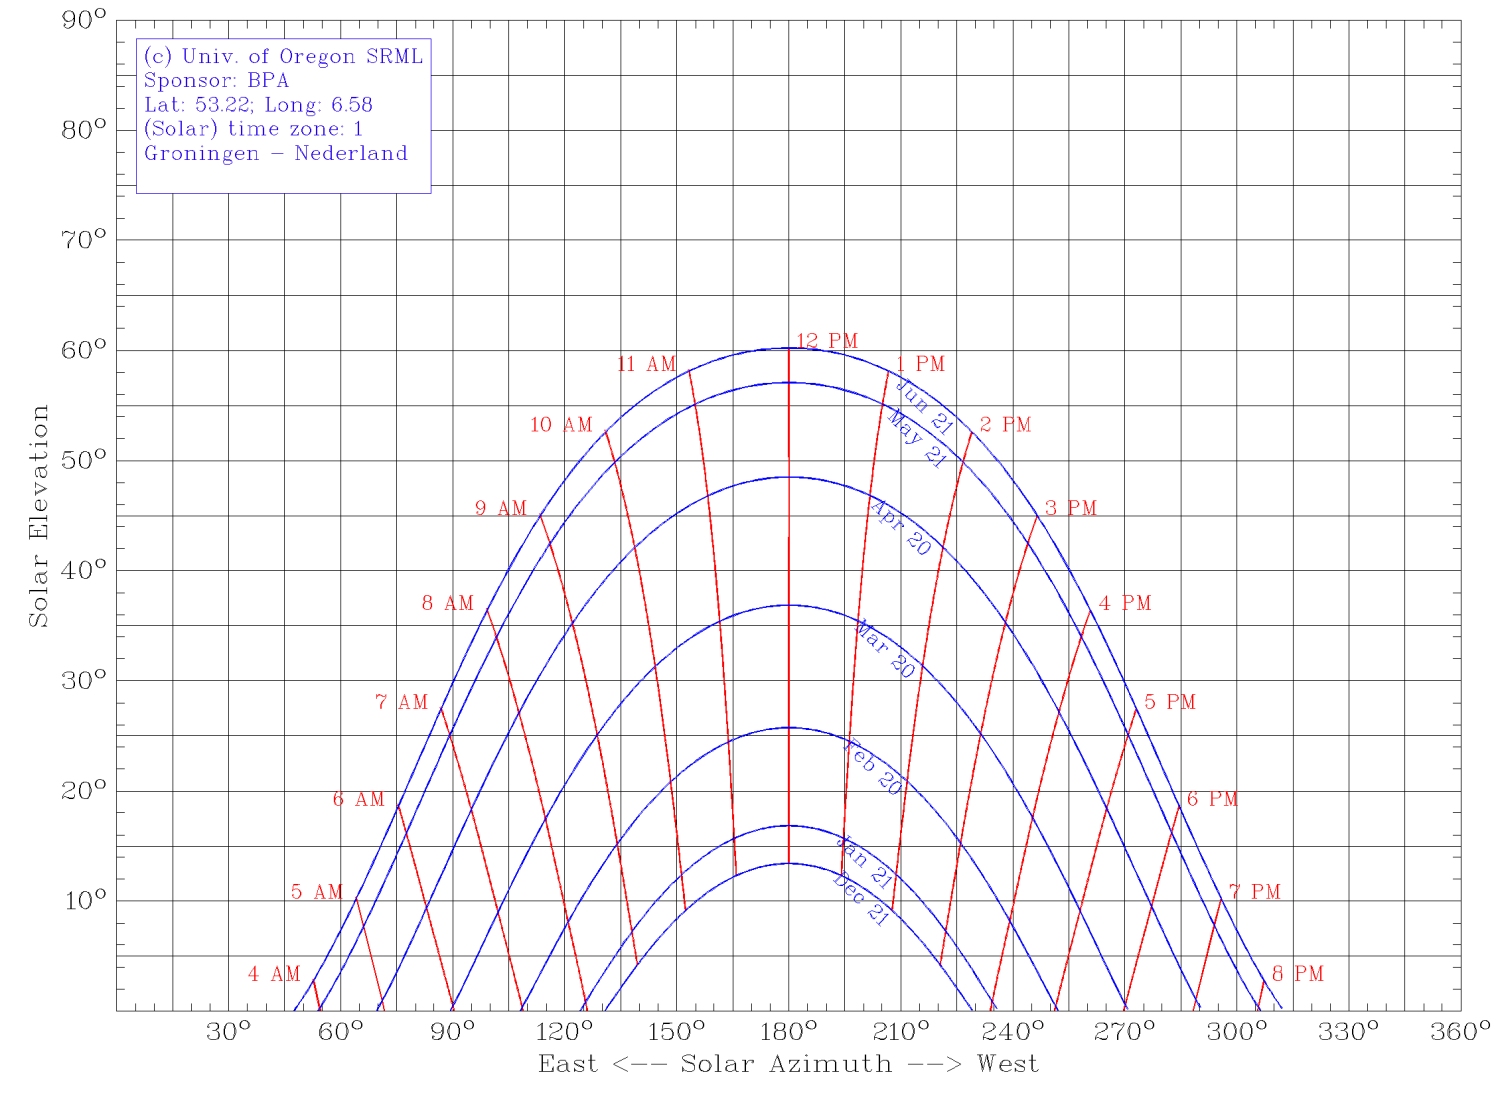
Sunchart to Groningen – Netherlands
But the method above is not as effective and illustrative as a three-dimensional representation showing the real conditions of shading during periods of intense sunlight, the summer equinox, and lower sunlight, during the winter solstice. In the example below, the summer solstice occurs in the middle of the year because it is a residence in the northern hemisphere. In this hemisphere the sun naturally continues rising in the East but its orientation is south. Thus, the roof chosen, oriented to the south, has a beautiful tree between planned photovoltaic panels and the sun.
In the case above, the client decided to remove the tree away from the path of its own energy. Blocking occurs only in winter, maybe a pruning could allow for better energy harvest. But it is likely that another smaller tree was planted on site.

This work by Synapsis is licensed under a Creative Commons Attribution- NonCommercial-NoDerivatives 4.0 International License
O projeto para instalação de painéis fotovoltaicos tem como desafio, além de uma efetiva orientação solar e posição geográfica, os impedimentos físicos da luz solar, edifícios, montanhas e vegetação periféricos. A copa de uma árvore pode não estar sombreando o local de instalação durante o verão, onde a orientação do sol está mais vertical. Porém no inverno, com o sol mais baixo, a copa pode impedir boa parte da captação dos fótons também. A Synapsis tem aqui uma explicação da orientação solar.
Para isto, uma análise do sombreamento do ano todo pode ser feita de algumas formas. Aqui, por exemplo, dois gráficos solares que mostram o caminho do sol em uma certa direção. A Universidade de Oregon fornece um mecanismo onde pode-se criar um para as exatas condições geográficas de cada instalação.
Gráfico solar para São Paulo – Brasil
Esta imagem é levada a campo, preferencialmente em um acetato. Orienta-se conforme o azimute indicado e tem-se o caminho do sol durante o ano todo e os possíveis impedimentos à insolação. O primeiro gráfico, acima, refere-se a São Paulo, note que com o Oeste (West) à esquerda e o Leste (East) à direita, devemos alinhar o azimute 0° a Norte. Enquanto no segundo, abaixo, que se refere a Groningen, no norte dos Países Baixos (Holanda), o contrário ocorre. Devemos orientá-lo para sul.
Gráfico solar para Groningen – Países Baixos
Porém nada é mais efetivo e ilustrativo do que uma representação tridimensional demonstrando as condições reais de sombreamento nos períodos de insolação maior durante o solstício de verão e menor durante o solstício de inverno. No exemplo abaixo, o solstício de verão ocorre no meio do ano pois trata-se de uma residência no hemisfério norte. Neste hemisfério o sol naturalmente continua nascendo a Leste porém sua orientação é de Sul. Assim, o telhado escolhido, orientado para o Sul, tem uma bela árvore entre os painéis fotovoltaicos planejados e o sol.
No caso acima, o cliente decidiu por retirar a árvore do caminho da sua própria autossuficiência energética. O bloqueio só ocorre no inverno, talvez uma pode pudesse possibilitar alguma captação. Mas é provável que uma outra árvore de menor porte tenha sido plantada no local.